Lifetime Earnings Profiles#
Among households in OG-ZAF, we model variations in the labor productivity over the lifecycle and between households of different skill groups. Together, these variations in productivity generate a distribution of earnings that is calibrated to match the level of inequality in South Africa. This chapter describes the calibration of the lifecycle earnings profiles and the distribution of earnings in the model.
Differences among workers’ productivity is one of the key dimensions of heterogeneity to model in a micro-founded macroeconomy. In this chapter, we characterize this heterogeneity as deterministic lifetime productivity paths to which new cohorts of agents in the model are randomly assigned. In OG-ZAF, households’ labor income comes from the equilibrium wage and the agent’s endogenous quantity of labor supply. In this section, we augment the labor income expression with an individual productivity \(e_{j,s}\), where \(j\) is the index of the ability type or path of the individual and \(s\) is the age of the individual with that ability path.
In this specification, \(w_t\) is an equilibrium wage representing a portion of labor income that is common to all workers. Individual quantity of labor supply is \(n_{j,s,t}\), and \(e_{j,s}\) represents a labor productivity factor that augments or diminishes the productivity of a worker’s labor supply relative to average productivity.
We calibrate the model such that each lifetime income group has a different life-cycle profile of earnings. Since the distribution on income and wealth are key aspects of our model, we calibrate these processes so that we can represent earners in the top 1 percent of the distribution of lifetime income.
We calibrate deterministic productivity paths such that each lifetime income group has a different life-cycle profile of earnings. The distribution of income and wealth are often focal components of macroeconomic models. These calibrations require the use of microeconomic data on household incomes, but this level of data is not readily available for South Africa from public sources or surveys. To overcome this, we start with the proposition that estimated productivity curves calibrated for the OG-USA model, generated from micro-level earnings data, represent a generalized relationship between age and lifetime income [DeBacker et al., 2017]. As such, our objective is to generate the curves for the U.S. and then adjust their generalized shapes to produce those for South Africa. In other words, our strategic approach is to begin with the lifecycle labor productivity profiles estimated from detailed U.S. data and then adjust these to match the distribution of income in South Africa. This is done in two ways (in this order):
Adjustment by income (\(J\)): adjust the gaps between the U.S. curves to match South Africa’s distribution between the \(J\)-income groups, using data from the World Inequality Database (WID);
Adjustment by age (\(S\)): adjust the shape of all the U.S. curves to match South Africa’s national distribution of income per capita for each age year, using data from the National Transfer Accounts database (NTA).
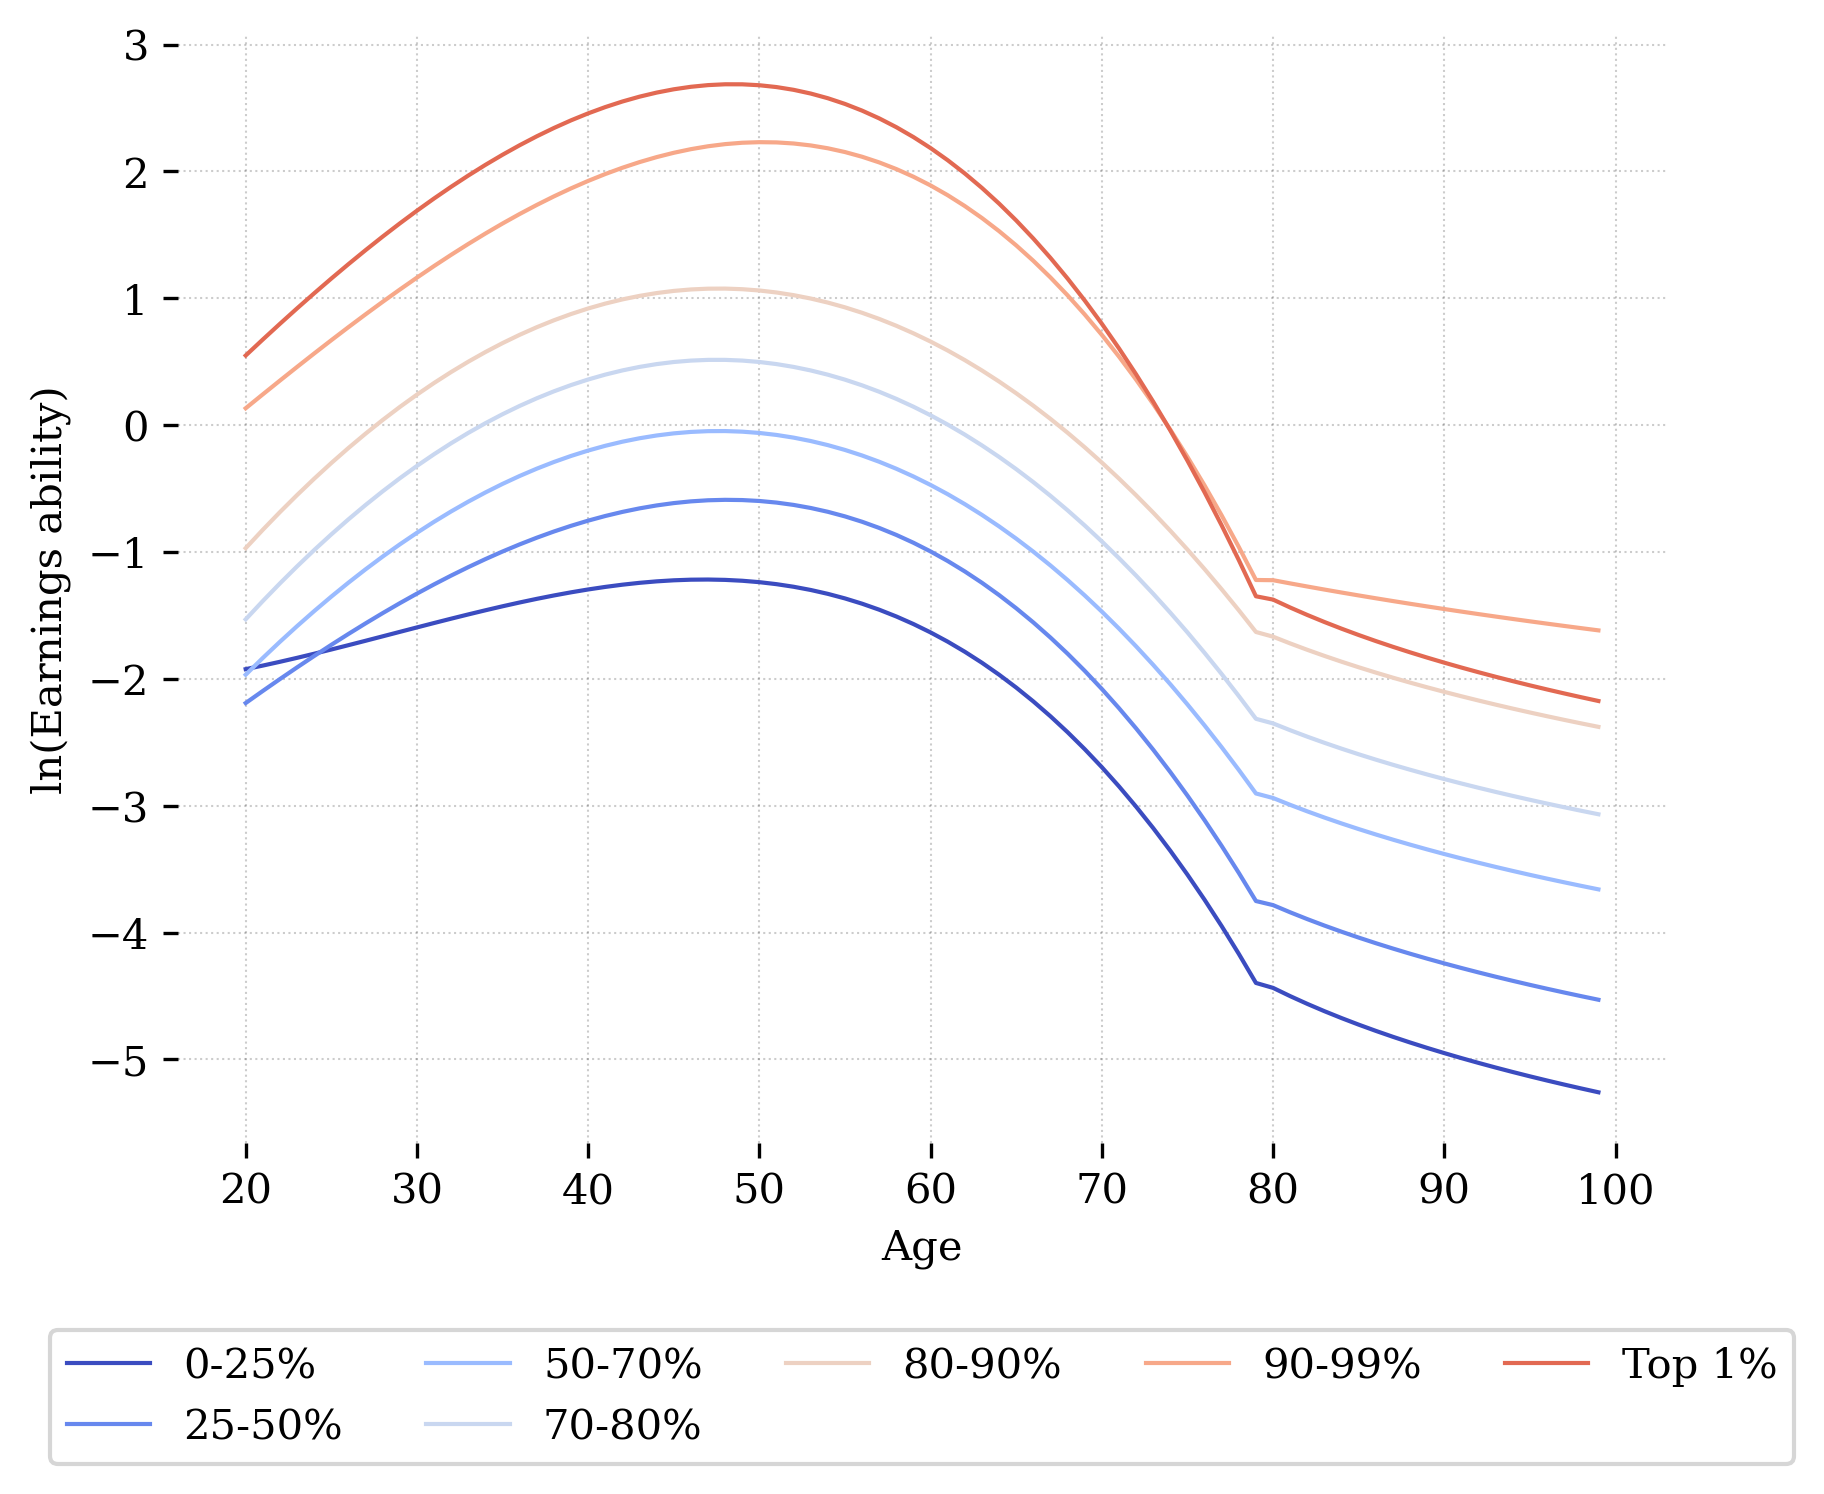
Fig. 8 Exogenous life cycle income ability paths \(\log(e_{j,s})\) with \(S=80\) and \(J=7\)#
Figure 8 shows a calibration for \(J=7\) deterministic lifetime ability paths \(e_{j,s}\) corresponding to labor income percentiles \(\boldsymbol{\lambda}=[0.25, 0.25, 0.20, 0.10, 0.10, 0.09, 0.01]\). Because there are few individuals above age 80 in the data, [DeBacker et al., 2017] extrapolate these estimates for model ages 80-100 using an arctan function.